Lost Creek Flux Tower
Site Description
| Basic measurements
| Equipment and Methods
| View plots
| FTP Data
| ChEAS Home Page
|
|
|
|
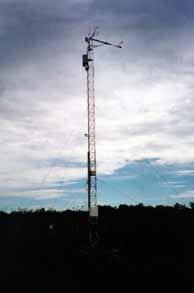
10 m Tower
|
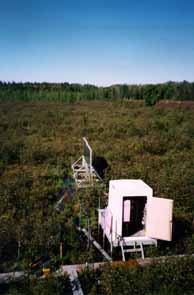
Instrument
shelter and solar panels
|
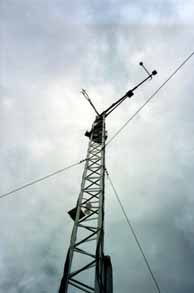
Sonic anemometer
and radiation sensors
|
|
|
|
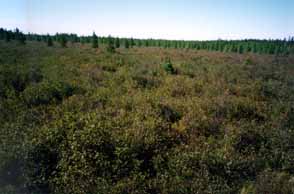
Alder thicket
viewed from tower base
|
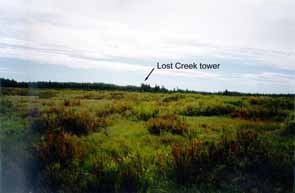
Mixed wetland
vegetation viewed from Hwy 47
|
Click here to see additional photos!
SITE DESCRIPTION
Location:
46° 4.9' N, 89°
58.7' W (click here for
aerial photographs)
Elevation:
approx. 480 m above sea level
(click here for topo map)
Annual Average Precipitation/Snowfall
(Park Falls, 1961-1990): 81.8 / 126.2 cm
Annual Average Temperature
(Park Falls, 1961-1990): 4.8°C
Stand age: unknown
Species Composition:
Alder-Willow (click here for
compartment maps)
Canopy height: approx.
1-2 m
Leaf Area Index (LAI):
to be determined
Average Stem Diameter at
Breast Height (dbh):
to be determined
Soils: Lupton, Cathro,
and Tawas mucks, 0-1% slope; these poorly drained soils formed on outwash
sands,
and are composed
primarily of sapric material about 0.75 m thick near the tower.
Established: 4
September 2000
BASIC MEASUREMENTS
- CO2
and H2O Fluxes
at 10.2 m
- CO2
mixing ratio profile (1.2, 1.8, 3.0, 5.5, and 10.2 m)
- H2
O mixing ratio (10.2 m)
- Above canopy radiation (10.2 m)
- Solar (incoming and reflected)
- Photosynthetically active radiation
- Net radiation
- Air temperature profile (1.2, 1.8,
3.0, 5.5, and 10.2 m)
- Soil temperature and moisture profile
(surface, 5, 10, 20, 50, 100 cm)
- Soil heat flux (7.5 cm)
- Surface water depth
- Tree stem temperatures (alder,
north and south facing)
- Leaf wetness indicator (10.2 m)
- Precipitation (rain and snow)
EQUIPMENT AND METHODS
Glen Martin fold over tower (30 ft)
CSI CR23X
datalogger, 4 Mb extended memory
CSI CR10X
datalogger, 1 Mb extended memory
CSI AM416
multiplexer
LI-COR 6262
(CO2/H
2O fluxes) and 6251 (CO
2 profile)
GAST 0532
rotary vane pump (for 6262) and Brailsford TD4x2NA double acting diaphram
pumps (for 6251)
¼"
(od) PFA or Dekabon 1300 tubing, and Gelman Acro 50 teflon inlet filters
High precision CO
2 profiler
(see Peter Bakwin
et al., 1998, Tellus 47B:535-549)
CSI CSAT Sonic
anemometer
CSI CS500
Temperature/Relative humidity sensor
LI-COR LI-200X
Silicon pyranometer
Kipp &
Zonan NR-Lite net radiometer
Kipp &
Zonan PAR-Lite Quantum sensor
CSI model
237 leaf wetness sensor
Type T thermocouples (soil/tree temperatures; air temperatures from 1.2 to
3.0 m)
CSI 10TCRXTCR
Thermocouple reference thermistor
REBS HFT-3
soil heat flux plate
Water depth pressure transducer (Omega PX242-005G)
Texas Electronics
6" tipping bucket rain gauge with CSI CS705 snowfall adapter and Onset Hobo
Event Logger
RAD Short-haul
modems and CSI SC32A optically isolated interface
Systemax portable
computer and Iomega 1 Gb Jaz drive
Astropower
120W solar panels
Trace C40
battery chargers and
24VDC/4400 AHr battery bank (Trojan T150s)
Sampling Frequencies:
0.1 second - eddy covariance
measurements (wind speed/direction, CO2
, H2O)
1 second - radiation,
air temperature, H2
O mixing ratio
1 minute - leaf wetness
10 minutes - air/soil/tree
temperatures, water table depth, soil heat flux
15 minutes - interval
between profile CO2
measurments for any level
Standards and Calibration:
CO
2standards - 340, 440, 550 ppm CO
2 in air (calibrated using NOAA primary standards).
CO
2 mixing ratio - LI-6251 zeroed every 45 minutes,
calibrated with 3 standards every 4 hours.
CO
2 and H2
O flux - LI-6262 continuously calibrated with LI-6251 and humidity measurements.
VIEW PLOTS (You will need
Adobe Acrobat
and/or Ghost View
to view these plots)
- Turbulent fluxes
- CO2
mixing ratios
- CO2
storage
- Net Ecosystem Exchange (NEE)
- Daily meteorology above canopy
(daily plots)
- Monthly soils data and
meteorology below canopy (monthly plots)
- Precipitation (annual
plots)
FTP DATA
- Turbulent fluxes
- CO
2 mixing ratios
- CO
2 storage
- Net Ecoystem Exchange
(NEE)
- Daily meteorology above
canopy
- Soils measurements and
meteorology below canopy
- Precipition
Page by Bruce Cook. Please send comments or questions to Kelly Cherrey